[INFOGRAPHIC] IT: Industry Figures
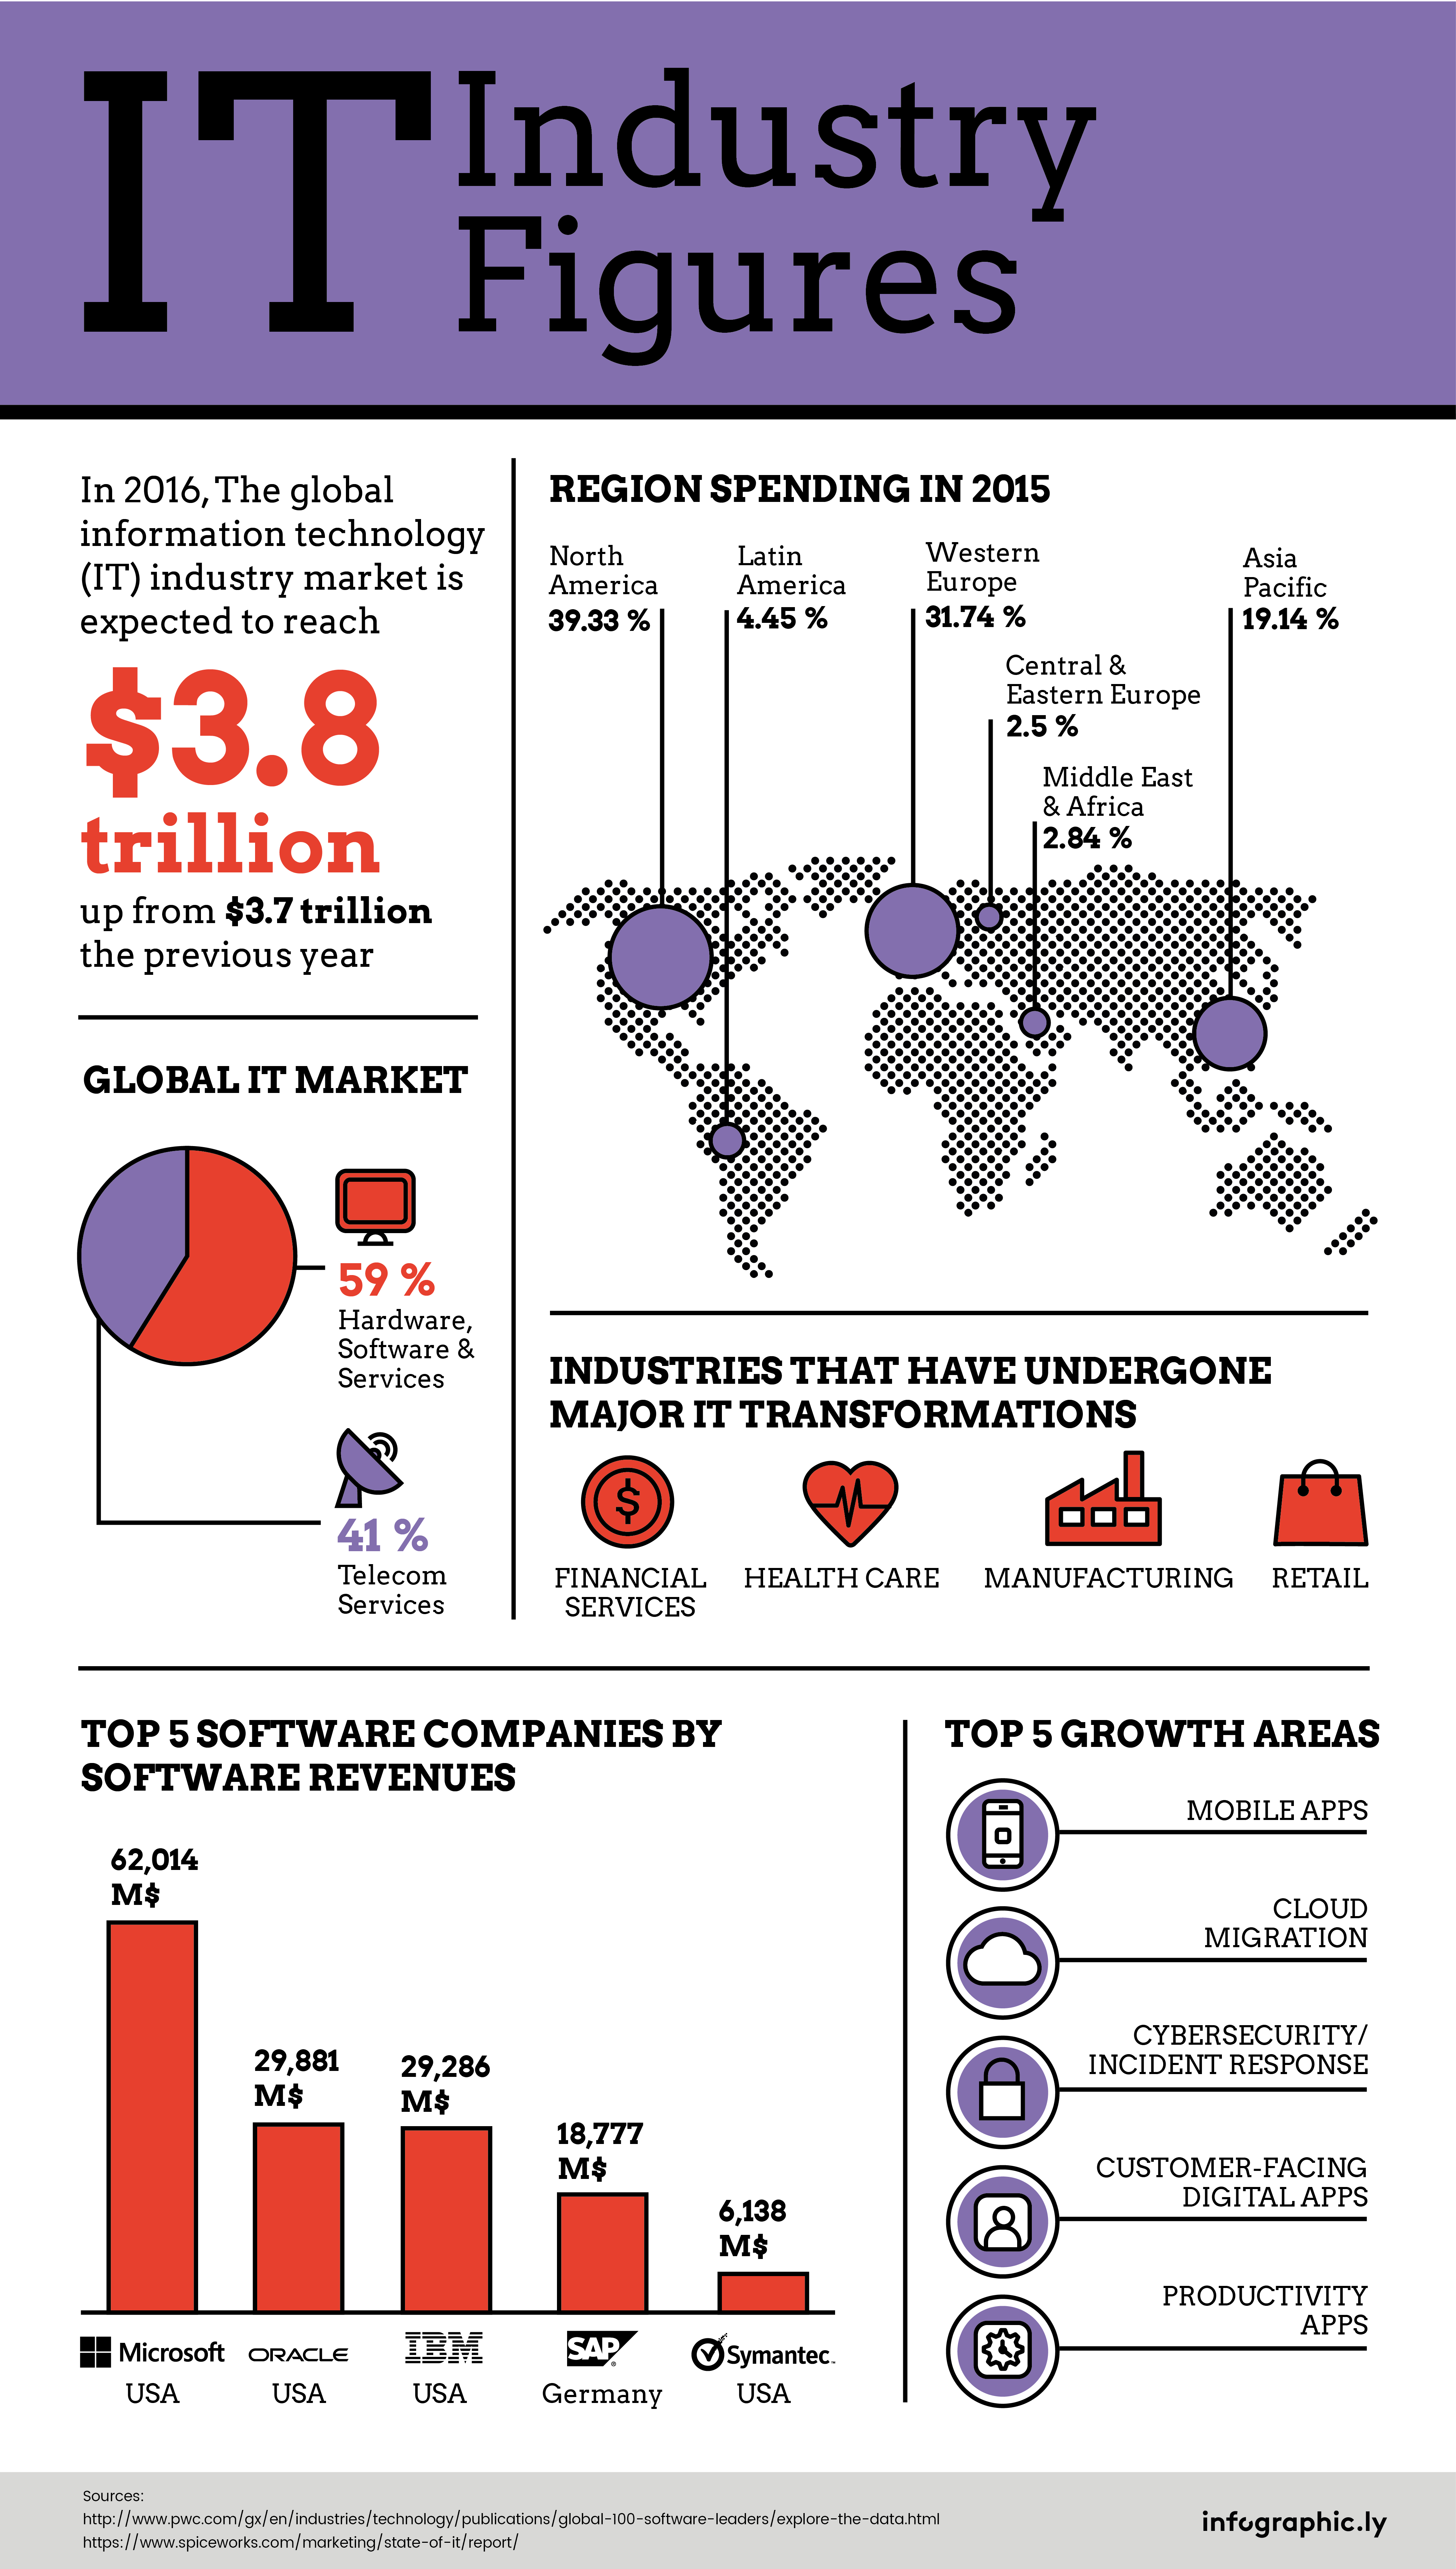
Like all industries and as we have seen in previous blogposts, the IT industry has also witnessed a radical impact of digitization. Though the market value is important in figures, its growth is slow. We can attribute it to the decrease in the price of technological components (e.g: storage space). It is expected to reach $3.8 trillion in 2016 up from $3.7 trillion in 2015 (Comtia, 2016).
North-America and namely the US, has been a predominant player in posing itself at the forefront of the industry with highest spending rate amongst other regions. Almost 40% of worldwide spending could be attributed to that region, with Europe following closely with 32%. Moreover, US companies have dominated the software market with 4 out of the top 5 companies being US based. To name a few: Microsoft, Oracle, IBM and Symantec. Amazon could be also regarded as a company who has integrated IT offerings in their list of services – an inexpensive cloud computing services called AWS (Amazon Web Services) that more and more companies are integrating in their IT infrastructure.
Financial services, Healthcare, Manufacturing and Retail are the industries that have been greatly impacted by the shift of IT. Though beneficial in terms of simplifying their services to customers and increasing productivity within the firm, companies do struggle to keep their systems updated in real time. In that regard, it is very important for firms to keep a ‘Digital First’ vision within the company. More importantly, IT departments and the different business functions of a company need to align the company goals so as to operate together and not in an ad hoc manner. In the short-term it would definitely reduce redundancy costs, but in the long term companies would greatly benefit from an IT architecture that is adapted to benefit each business function (Reply, 2016).

