[INFOGRAPHIC] The Era of Visual Mediation
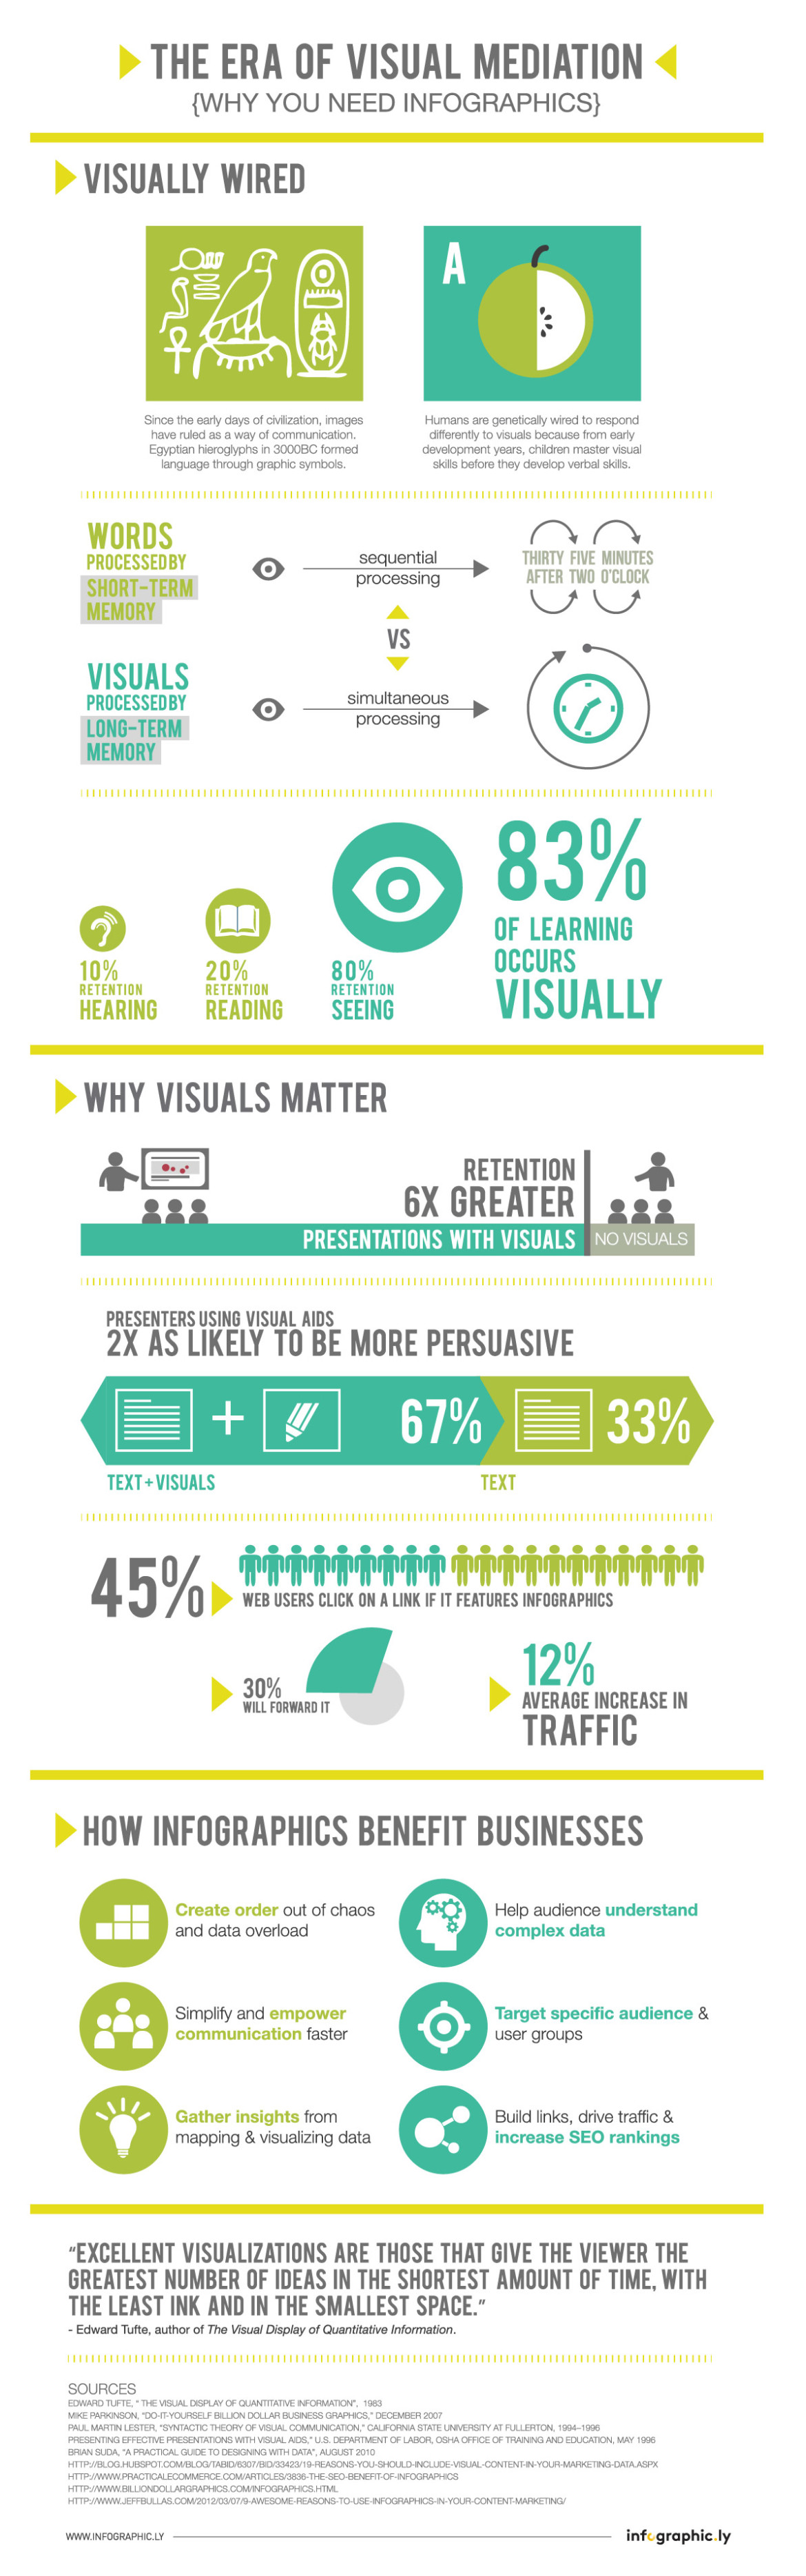
“A picture is worth a thousand words.” We’ve all heard that one before. A time-trusted adage that has passed through generations of data-challenged civilizations and that has become increasingly relevant with the mass proliferation of content and information. Just think of the number of times you went on holiday and later tried to recount a story that only your 537 photos from your 12 megapixels camera were able to give justice to? What about the countless times you fell asleep got bored and lost focus during a presentation that was simply too print heavy. Visuals remain amongst the strongest tools in engaging audiences to your messages. In fact, visual mediation can be traced back all the way to early civilizations from the Mesopotamian Empire to the Roman Empire, where cave paintings and pictographs were used as a means of communication. But what is it about the visual form that makes it such a powerful tool for communication?
The answer is in our evolutionary past. We are genetically wired to understand information faster and better through images than words. It’s part of our DNA. Development theory and research studies have proven that children master visual skills before they even begin to develop verbal skills. So unless you’re a national spelling bee finalist, from Krypton, or Rain man himself your brain is programmed to decipher and store images into your long-term memory much quicker than words which are processed by your short-term memory. Just try spelling Schwarzenegger out loud. Now backwards. Ok just messing with you. Luckily for us though, it’s the 21st century and the era of big-time multimedia and vibrant kick-ass colours.
However, whether you’re a baby boomer, Gen X or a millennial, you can’t deny the fact that we are also living in the age of information overload and ‘big data’ (that trending buzzword that has put ‘innovation’ in the corner next to ‘baby’. Oh wait. Nobody puts… never mind). So how do we stay afloat this excess of information that we are drowned in? How do we communicate complex data and processes in layman terms?
Two words: visual mediation. A graphic intervention that engages us by facilitating the understanding and retention of information, which shapes our perceptions, drives our decisions, and helps discover insights through the mapping and visualizing of data. This is what infographics and data visualization are all about.