[INFOGRAPHIC] Defense Spending and Arms Trade in Numbers
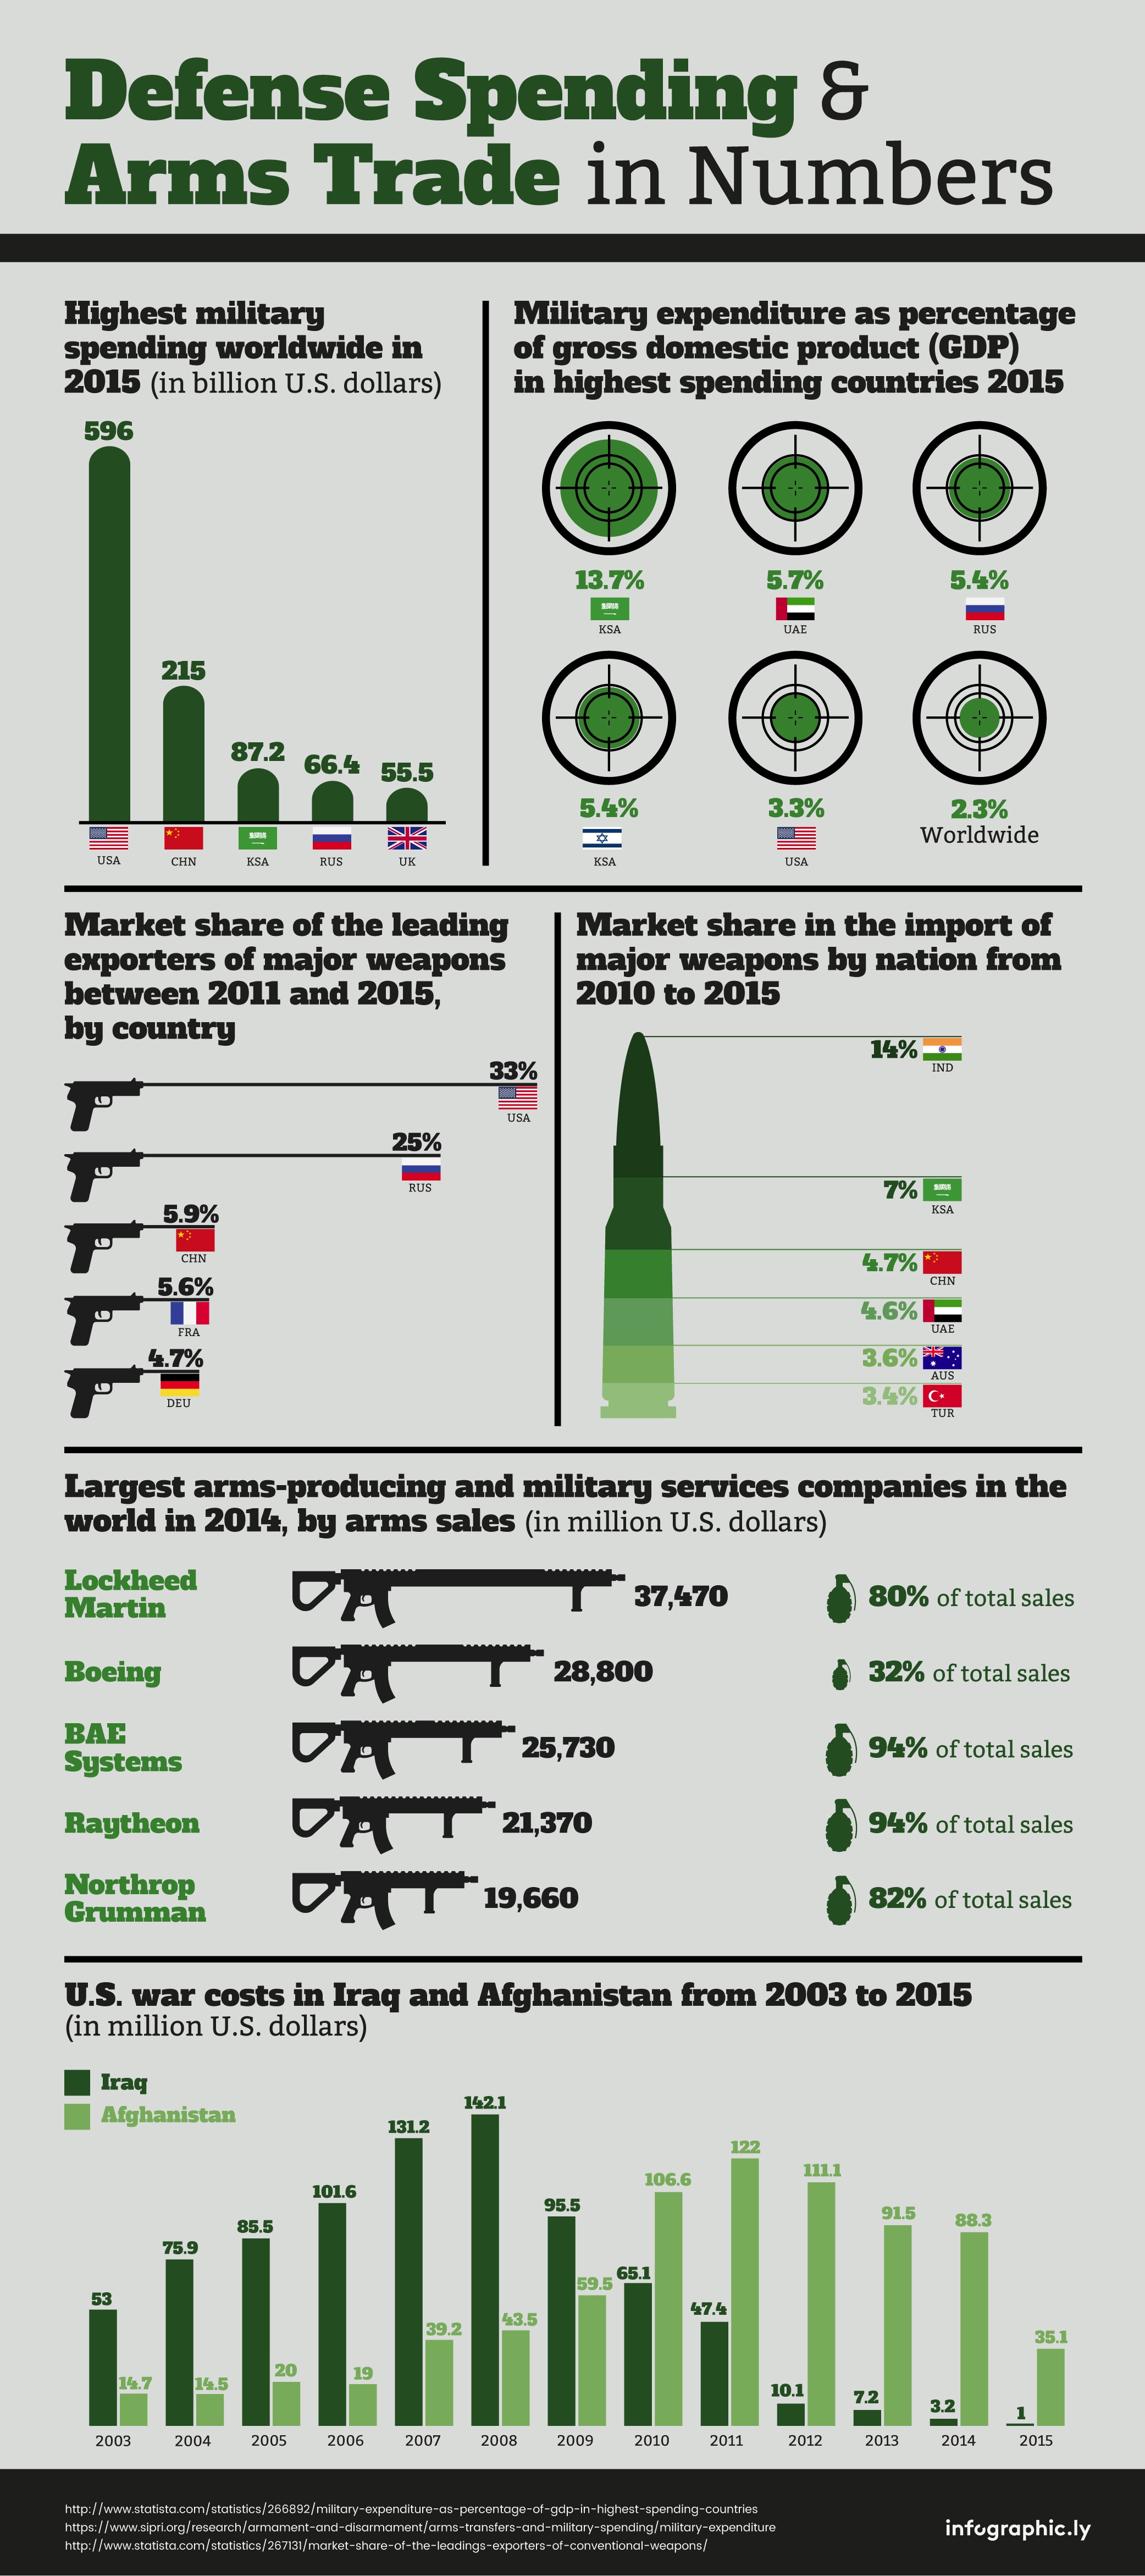
This week we look at the major players in defense spending and arms trade. It comes as no surprise that in terms of spending the USA dominates with $596 Billion U.S Dollars in 2015. This is more than double that of its counterparts in China, Saudi Arabia and Russia. Although it represents only 3.3% of its GDP compared to other countries like the UAE and Saudi Arabia, it holds the biggest market share in the export market. The largest arms-producing and military services companies in the world in 2014, measured by arms sales were Lockheed Martin and Boeing, both US companies, whose total sales were $60 Billion US Dollars. It is interesting to see however that in terms of market share of imports, India remains at the top with 14% of market share. This could be explained very simply by the fact that they do not have a defense system in place that enables them to manufacture the arms they need with the necessary technology they require. Indeed, and according to SIPRI (Stockholm International Peace Research Institute:Indian arms industry has so far largely failed to produce competitive indigenously-designed weapons”.
On a general level however, US spending has decreased in the recent years but in the advent of the Trump era, we can assume that the figures could drastically change in the near future.