
Why Infographics are The Future of Education
What if I told you that data visualization isn’t just about…
[INFOGRAPHIC] Disrupting Finance: The Case of FinTechs
The rise of digital technology has been the catalyst for the rapid…
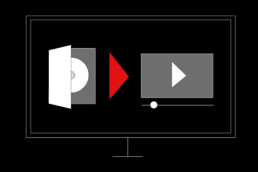
[INFOGRAPHIC] The Case of Netflix: What It Did Right
While the rise of digital technologies have taken industries by…

[INFOGRAPHIC] 2016 Most Popular Halloween Costumes
Take a look at the most popular Halloween costumes of 2016.

The Value of Getting Your Branding Right
There’s a reason Apple is worth $733 billion. Good branding. In…

[INFOGRAPHIC] Global Modern Slavery 2016
Slavery is a term that many don’t associate with modern times;…
How to Use Data Visualization for an Annual Report
Large filing systems used to be the order of the day for most…

How To Use Iconography Effectively In Design
Design is a minefield. It’s difficult to design something well, and…

How to Design For a Global Audience
My job is awesome. I work with all different kinds of people from all…


The Importance Of Negative Space in Design
We’ve gone through the dos and don’ts of design and how to design…

Keeping it Simple: Why Simplicity is Best in Design
There’s no escaping that we as a species love Apple products.…
Why You Should Treat Designers Like Amazon Prime
When we shop on Amazon, we do it because we know the stuff is good…

Beyond Comic Sans: How to Master Typography
Put your hands up if you’ve ever used Comic Sans. It’s OK, we’ve all…