7 Awesome Interactive Infographics We Love
We all know infographics are super-effective for business. They drive traffic, are super-shareable and establish credibility for a brand. Humans love infographics because we’re visually wired – in fact, psychologists have discovered that 83% of learning occurs visually.
When motion is introduced to an infographic it can make it more effective, more powerful and even more shareable. If you ask us, motion infographics are the future of visual communication design!
We’ve searched the internet high and low for the best interactive and animated infographic designs that communicate data in beautiful, creative ways.
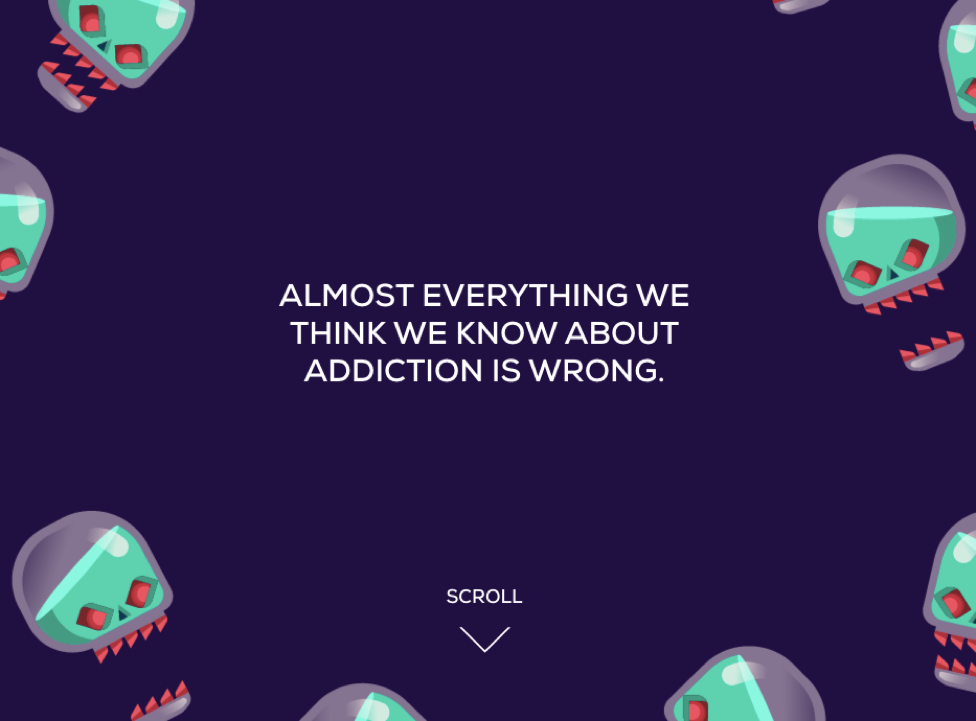
The One That Busts Myths
It turns out that what we think we know about drug addiction is all wrong. Drug addiction isn’t a physical dependency after all, and this infographic illustrates this difficult topic in an easy-to-digest and sensitive way.
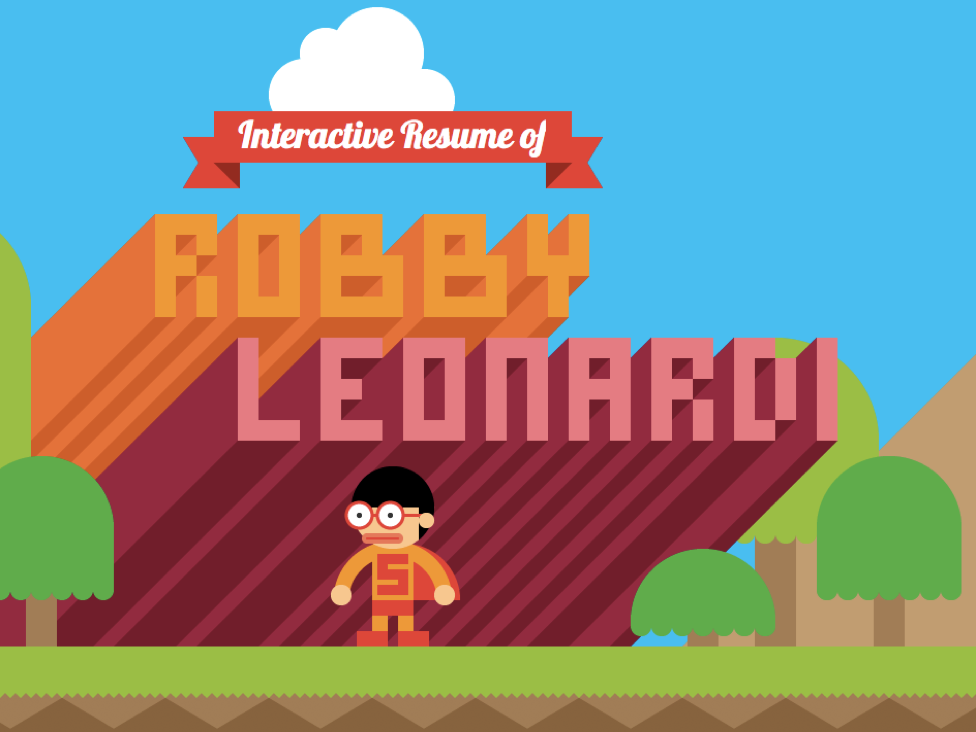
The One That’s A Resume
It’s a struggle to come up with new and inventive ways of presenting your CV or resume to potential employers. This guy’s done it though with this brilliant Super Mario-style interactive resume.
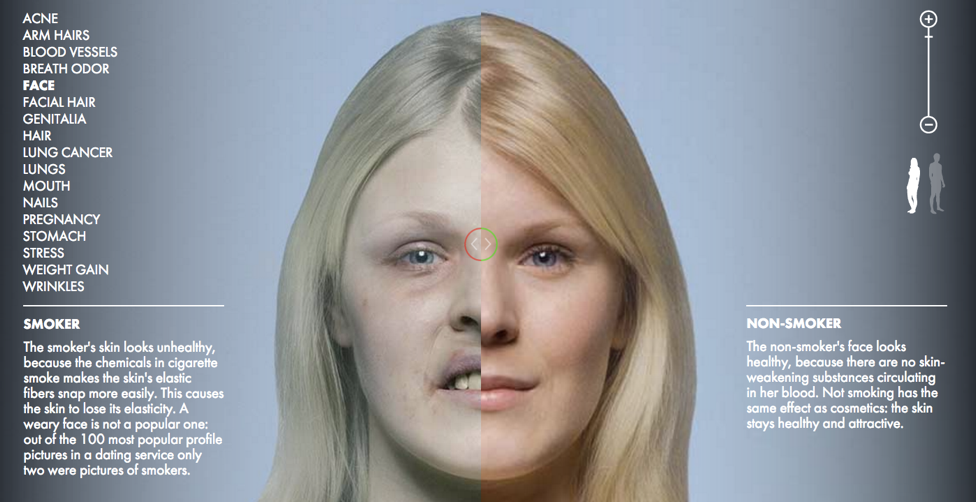
The One That Will Stop You Smoking
This clever infographic from The Cancer Society of Finland puts the impact of the damage smoking does to a person’s body right in front of you.
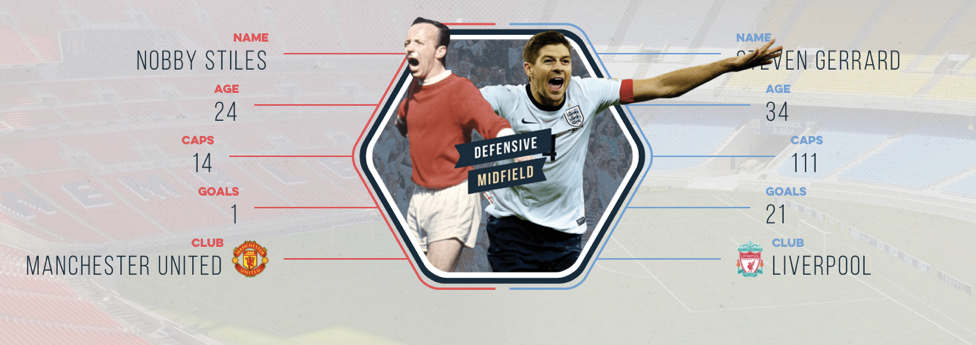
The One For Football Fans
Football. Statistics. Infographics. They all go hand-in-hand. This well-designed infographic compares the winning England 1966 World Cup squad with the last world cup team.
The One That Blows Your Mind
Facebook paid HOW much for WhatsApp? This infographic puts the $19bn sale into perspective.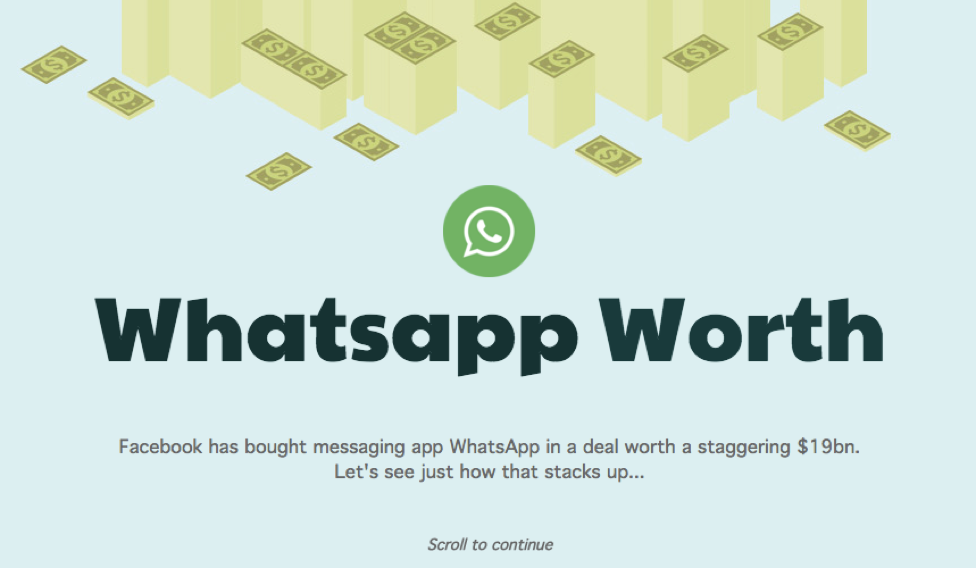
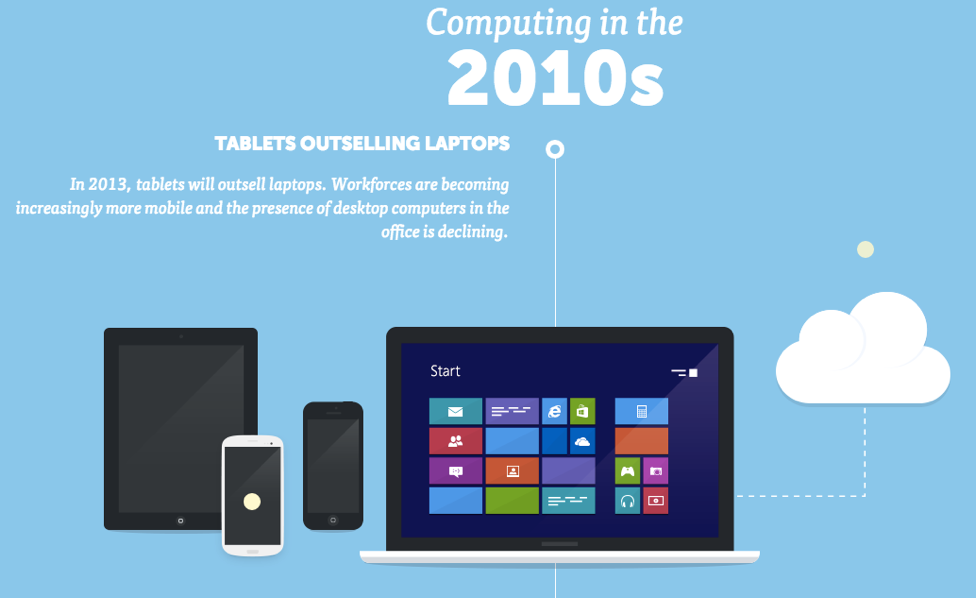
The One That’s Really A History Lesson
In the history of the planet, 70 years is merely a blip – but what a blip it’s been. This infographic shows you the phenomenal technological progress we’ve made in that time.
The One We Made
OK so we might be a bit biased with this one, but we love it! And it’s all about becoming a little greener. The planet wins, you win, everyone wins.

Have you got a favourite we’ve missed? Share it with us on Twitter @infographicly_